
Learn how to start a physical climate risk assessment with a step-by-step beginner guide for SMEs. Covers scope, hazards, exposure, and sensitivity with detailed examples.
🎯 Key Takeaways
- A physical climate risk assessment does not need to be complex to deliver value
- Start with a structured approach: scope → hazards → exposure → sensitivity
- Focus on specific assets and locations, not the entire company at once
- Climate risk becomes actionable only when linked to real business impact
- Even simple assessments can reveal critical vulnerabilities quickly
- It is a starting point, not the end goal—companies should later move to scenario analysis and financial modeling
- In Asia, where risks are frequent and interconnected, starting early is a practical competitive advantage
Start your ESG journey with a practical checklist (built for Asia) No theory. No frameworks overload. Just what you can apply. 👉 Download Free
Introduction: Why Start Simple Matters
Across Asia, physical climate risks are no longer theoretical. Floods in Vietnam, heatwaves in India, typhoons in the Philippines—these are already affecting operations, supply chains, and financial outcomes.
Yet many companies—especially SMEs or first-time ESG reporters—face a barrier: Climate risk assessment feels too complex to start.
This is where a simplified assessment approach becomes valuable.
This guide is designed for:
- SMEs
- First-time ESG reporters
- Companies without access to advanced climate modeling
It focuses on building a practical foundation, not perfection.
Importantly, this is not the end state. As companies mature, they should move toward:
- Scenario analysis
- Financial quantification
- Forward-looking climate modeling (aligned with TCFD / ISSB)
But before that, they need a clear, structured starting point.
🧭 Step 1: Define Scope — What Exactly Are You Assessing?
One of the most common mistakes companies make when starting a climate risk assessment is trying to cover everything at once.
In practice, a climate risk assessment is not meant to evaluate “the entire company” in one step. It should focus on specific assets, locations, and operational dependencies—the parts of your business that actually generate revenue or keep operations running. Without this level of precision, the assessment quickly becomes too abstract to be useful.

What should be included in the scope?
At a minimum, companies should focus on the core elements that directly affect business continuity:
- Physical assets: factories, offices, warehouses, and production facilities
- Key suppliers: especially those providing critical inputs or materials
- Logistics routes: ports, transport corridors, and distribution pathways
These elements form the backbone of your operations. If any of them are disrupted by climate events, the business impact is immediate and measurable.
For companies that are slightly more advanced—or operating in higher-risk environments—the scope should be expanded.
Example: Vietnamese Manufacturing SME
Consider a mid-sized garment manufacturer operating in Vietnam. A practical and focused scope might include:
- A primary factory located in Bình Dương
- A key fabric supplier based in China
- Export operations routed through Cát Lái Port in Ho Chi Minh City
Even with this relatively simple scope, the company is already capturing multiple layers of climate risk:
- Production risk: If flooding or heatwaves affect the factory, manufacturing output is disrupted
- Supply chain risk: If extreme weather impacts the supplier in China, raw material delivery may be delayed
- Logistics risk: If port operations are affected by storms or congestion, exports may be delayed or canceled
This illustrates an important point: 👉 A well-defined scope does not need to be large—it needs to be strategically chosen. For companies just starting out, the goal is not to be exhaustive, but to be focused and decision-relevant. A smaller, well-defined scope that captures your most critical operations will always be more valuable than a broad but superficial assessment.
🌦️ Step 2: Identify Relevant Climate Hazards
Once you have clearly defined your scope, the next step is to understand a critical question:
What climate events could realistically affect these specific locations?
Before going further, it is important to clarify what we mean by a climate hazard.
What is a Climate Hazard?
A climate hazard refers to a physical event or long-term climate pattern that has the potential to cause damage, disruption, or loss to assets, operations, or people.
These hazards can be:
- Acute (event-driven): sudden events such as floods, storms, or heatwaves
- Chronic (long-term shifts): gradual changes such as rising temperatures, sea-level rise, or increasing drought frequency
In a climate risk assessment, hazards are the starting point. Without identifying the right hazards, the rest of the analysis—exposure, impact, and mitigation—will not reflect reality.

Common Climate Hazards in Asia
Asia is one of the most climate-exposed regions globally, with a combination of geography, urban density, and economic structure amplifying risk.
Some of the most relevant hazards include:
- Flooding (urban and river flooding): Driven by heavy rainfall, poor drainage systems, and river overflow. Particularly severe in rapidly urbanizing cities.
- Extreme rainfall: Increasing intensity of rainfall events, often overwhelming infrastructure and causing cascading disruptions.
- Heatwaves: Rising temperatures and prolonged heat periods that affect labor productivity, equipment performance, and energy demand.
- Drought: Water scarcity impacting agriculture, manufacturing processes, and energy generation.
- Tropical storms / typhoons: High-impact events that can damage infrastructure, disrupt logistics, and halt operations entirely.
- Sea-level rise (coastal areas): A slower-onset risk that can lead to chronic flooding, land loss, and long-term asset devaluation.
👉 Importantly, most locations in Asia are exposed to multiple overlapping hazards, not just one.
Example: Southern Vietnam Factory
Consider a factory located in Bình Dương, a major industrial hub near Ho Chi Minh City.
A basic hazard identification might look like this:
- Flood risk → High: The region experiences heavy rainfall during the monsoon season, combined with urban drainage limitations.
- Heatwaves → Increasing: Rising average temperatures and more frequent extreme heat days affect worker productivity and cooling costs.
- Storms → Low/Moderate: While less exposed than coastal areas, storms can still disrupt supply chains and logistics.
This example highlights an important principle: 👉 Hazard identification is location-specific, not industry-specific.
How to Identify Hazards (Beginner-Friendly Approach)
At this stage, the goal is not precision—it is relevance.
You do not need advanced climate models to begin. Instead, focus on combining simple, accessible sources:
1. Historical Events
Start by asking:
- What climate events have already occurred in this location?
- How frequently do they happen?
Past events are often the most reliable indicator of current exposure.
2. Government and Local Data
National meteorological agencies, environmental ministries, and local authorities often publish:
- Flood maps
- Heatwave records
- Storm frequency data
These are highly valuable and often underused.
3. Public Risk Tools
Platforms such as ThinkHazard (World Bank) provide:
- Hazard screening by location
- Risk categories across multiple hazard types
These tools are particularly useful for companies with limited internal resources.
Practical Tip: Start Broad, Then Narrow
At the beginning, it is better to:
- Identify all plausible hazards
- Then narrow down to the most relevant ones
Avoid the common mistake of ignoring a hazard simply because it has not happened recently. Climate patterns are changing, and historical stability does not guarantee future safety.
It is worth to note that at this stage:
- You are not predicting future climate scenarios
- You are identifying which hazards are relevant today
This distinction is critical.
A basic assessment focuses on:
- Current exposure
- Known risks
- Observable trends
More advanced approaches—such as climate scenario analysis (e.g., 1.5°C or 2°C pathways)—come later, once a foundational understanding is in place.
For companies in Asia, where climate risks are both diverse and intensifying, taking the time to properly identify hazards is one of the highest-impact steps in the entire process.
Most companies don’t fail at ESG because they don’t care — they fail because they don’t have a clear structure.
I’ve simplified this into a step-by-step ESG checklist you can actually use. 👉 Get it here
📍 Step 3: Map Exposure — Are You Actually at Risk?
Once you have identified relevant climate hazards, the next step is to answer a simple but powerful question:
Is your asset physically located in a place where the hazard occurs?
This is what exposure means in a climate risk assessment.

What is Exposure?
Exposure refers to the extent to which your assets, operations, or supply chain are physically located in areas that are susceptible to specific climate hazards.
It is purely about geography and location, not about how vulnerable or resilient the asset is—that comes later (in sensitivity).
In simple terms:
- Hazard = What could happen (e.g., flooding)
- Exposure = Are you in the path of it?
Why Exposure Matters
Exposure is one of the most important—and often underestimated—steps in a climate risk assessment.
Two companies can face the exact same hazard, but their actual risk can differ dramatically depending on where they are located.
Example
Consider two factories operating in the same country:
- Factory A: Located in an elevated industrial park with good drainage infrastructure → Low flood exposure
- Factory B: Located near a river in a low-lying area → High flood exposure
Both face the same hazard (flooding), but: Same hazard → different exposure → very different risk levels
This is why exposure mapping is essential—it determines whether a risk is theoretical or operationally relevant.
Practical Method: Build a Simple Exposure Map
At a beginner level, exposure can be assessed using a simple table that links assets to hazards and assigns a qualitative exposure level.
Asset | Hazard | Exposure |
Factory A | Flood | Low |
Factory B | Flood | High |
You can expand this table over time to include:
- Multiple hazards per asset
- More locations (suppliers, logistics hubs)
- Additional context (e.g., elevation, distance to coast)
The goal is not complexity—it is clarity and comparability.
How to Assess Exposure (Beginner-Friendly Approach)
You do not need advanced geospatial tools to assess exposure effectively. A structured, common-sense approach is often enough. The following example is for flood hazard.
1. Check Elevation and Proximity to Water
- Is the asset located in a low-lying area?
- Is it near a river, canal, or coastline?
Low elevation and proximity to water are strong indicators of flood exposure.
2. Use Flood Maps or Historical Flood Zones
- Review publicly available flood maps
- Look at areas that have experienced flooding in the past
If a location has flooded before, it is likely to flood again—often with increasing severity.
3. Identify Coastal vs Inland Assets
- Coastal assets → exposed to sea-level rise and storm surges
- Inland assets → more exposed to river flooding or heat stress
This helps quickly differentiate risk profiles across locations.
4. Consider Surrounding Infrastructure
- Is the asset located in an industrial park with proper drainage?
- Or in an area with limited infrastructure capacity?
Infrastructure quality can significantly influence real exposure.
5. Extend Beyond Direct Assets
Exposure should not be limited to owned assets. It should also include:
- Suppliers: Are key suppliers located in high-risk areas?
- Logistics routes: Do transport corridors pass through flood-prone regions?
- Ports and hubs: Are critical export/import nodes climate-exposed?
Many companies underestimate risk because they focus only on what they own, not what they depend on.
Common Mistakes to Avoid
- Assuming all locations in a country have the same risk
- Ignoring indirect exposure (suppliers, logistics)
- Relying only on general climate narratives instead of location-specific data
Exposure is always local and specific.
👉Key Insight
For many companies—especially those just starting—exposure mapping is: The highest-impact, lowest-complexity step in the entire assessment
It often reveals major risks immediately, without requiring advanced modeling or detailed data.
⚠️ Step 4: Assess Sensitivity — How Severe Would the Impact Be?
By this stage, you already understand where you are exposed. The next step is to determine:
If a climate event happens, how severely will it affect your business?
This is what sensitivity measures.
What is Sensitivity?
Sensitivity refers to how strongly an asset, operation, or system is affected when exposed to a climate hazard.
In simple terms:
- Exposure tells you if you are at risk
- Sensitivity tells you how bad it gets when the risk materializes
Two assets can be in the exact same location, facing the same flood or heatwave—but experience very different levels of damage and disruption.

Key Questions to Assess Sensitivity
To evaluate sensitivity, you need to move beyond location and think about operational impact.
Ask:
- Would operations stop entirely, or continue with disruption?
- Would physical assets be damaged, and how severely?
- How long would it take to recover? Hours, days, or months?
These questions help translate climate events into real business consequences.
Example: Flood Impact Across Different Assets
Consider two assets exposed to the same flood event:
Asset | Sensitivity |
Warehouse | Medium (temporary disruption, recoverable stock movement) |
Electronics factory | High (damage to sensitive machinery, costly downtime) |
Even though both are exposed to flooding:
- The warehouse may experience short-term disruption, with relatively quick recovery
- The electronics factory may face severe financial loss, due to equipment damage and production stoppage
What Drives Sensitivity?
Sensitivity is shaped by how your business is designed and operated. Several factors play a role:
1. Type of Operations
- Continuous production (e.g., manufacturing lines) → highly sensitive
- Intermittent or flexible operations → lower sensitivity
2. Value and Nature of Equipment
- High-value or specialized machinery → higher sensitivity
- Standard or easily replaceable equipment → lower sensitivity
3. Recovery Time
- Can operations resume within hours or days?
- Or does recovery require repairs, replacement, or recalibration over weeks?
Longer recovery = higher sensitivity.
4. Dependence on Continuous Production
Industries like electronics, chemicals, or food processing often cannot tolerate downtim. Even short disruptions can lead to:
- Missed contracts
- Penalties
- Supply chain breakdowns
5. Workforce and Working Conditions
- Heat-sensitive environments (e.g., outdoor labor, factories without cooling)
- Worker safety risks during extreme weather
These factors increase operational vulnerability, even if assets are intact.
Practical Tip: Use Qualitative Ratings
At a beginner level, sensitivity does not need precise quantification.
A simple scale works well:
- Low → Minimal disruption, quick recovery
- Medium → Noticeable disruption, manageable impact
- High → Severe disruption, costly or prolonged recovery
This keeps the assessment:
- Consistent
- Comparable across assets
- Easy to communicate internally
Common Mistakes to Avoid
- Assuming all assets in the same location have the same sensitivity
- Focusing only on physical damage and ignoring operational disruption
- Underestimating recovery time and indirect costs
Sensitivity is not just about damage—it is about business interruption.
👉Key Insight
Even within the same location: Different assets = different vulnerabilities
Understanding sensitivity allows you to move from:
- “This location might flood” to
- “This specific operation could shut down for 5 days and cost X amount”
This is a critical shift—from climate awareness to business-relevant risk understanding.
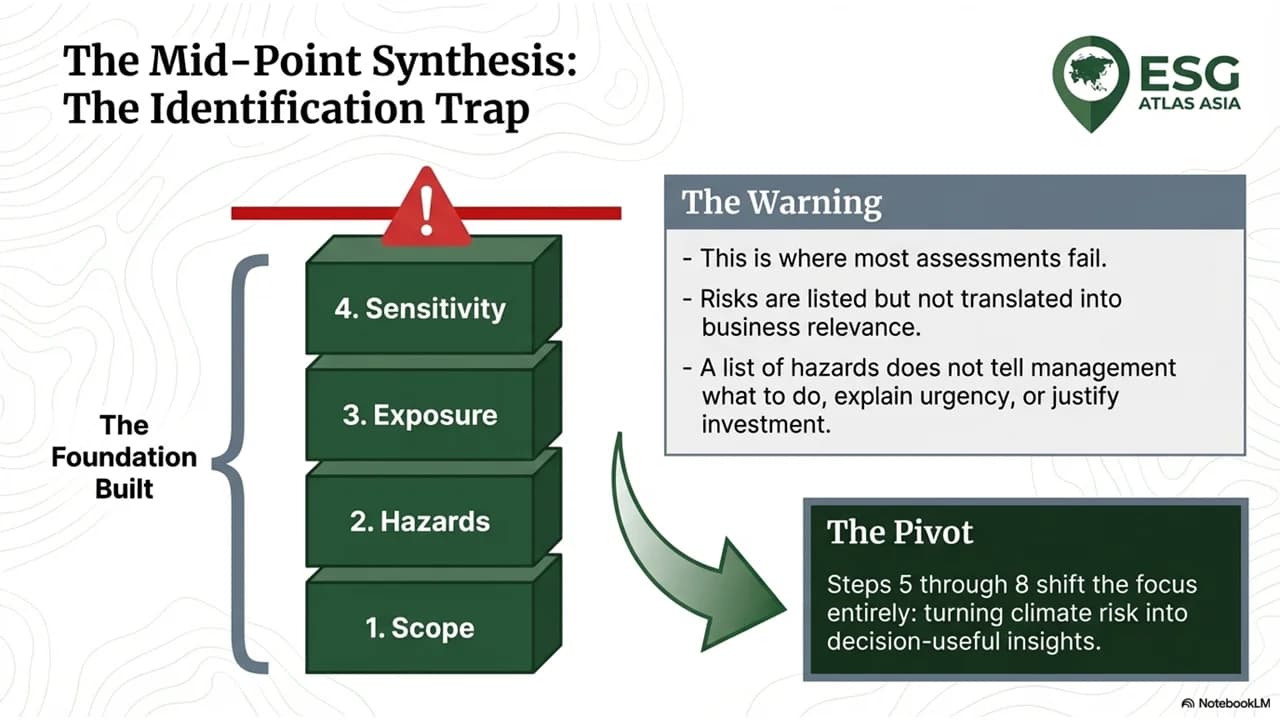
🔍 Step 5 Preview: Why This Matters
By the end of these steps, you have built a structured, location-specific view of your climate risk exposure.
You have:
- Clearly defined your scope, focusing on the most critical assets and dependencies
- Identified relevant climate hazards based on real-world conditions
- Mapped exposure, understanding where those hazards intersect with your operations
- Assessed sensitivity, determining how severely each asset could be affected
Taken together, these steps move you beyond general awareness into something far more useful: a practical, decision-ready foundation for climate risk analysis
At this stage, you are no longer asking “What climate risks exist?”. You are now able to ask “Which risks actually matter to our business, and where?”
What This Enables Next
With this foundation in place, you are ready to move into the next phase of the assessment:
- Risk scoring → Prioritizing which risks are most critical
- Business impact analysis → Translating climate risks into operational and financial consequences
- Action planning → Identifying practical mitigation and adaptation measures
These steps transform your assessment from a descriptive exercise into a management tool.
Continue to Part 2: How to Assess Physical Climate Risk: Physical Risk Scoring & Mitigation Guide (Part 2)
Asia-Specific Considerations
For companies operating in Asia, physical climate risk is not a distant or emerging issue—it is already embedded in day-to-day operations. This regional context is important, because it means even a simplified assessment can deliver immediate value.
Climate risks are more frequent—and often more intense
Many parts of Asia experience higher frequency of extreme weather events, combined with increasing intensity over time. Monsoon patterns, tropical storms, and prolonged heat periods are becoming less predictable, which makes operational planning more challenging.
For businesses, this means disruption is not a rare event—it can be seasonal or even expected.
Urban flooding is a structural risk
Rapid urbanization across cities such as Ho Chi Minh City, Jakarta, and Bangkok has created structural flood exposure:
- High population density
- Limited drainage capacity
- Expansion into low-lying areas
Even moderate rainfall can lead to operational disruption, particularly for:
- Warehouses
- Retail locations
- Industrial zones
Unlike one-off disasters, urban flooding is often a recurring operational issue, not an exceptional event.
Supply chains are regionally interconnected
Asian supply chains are highly integrated across countries. A single product may depend on:
- Raw materials from one country
- Manufacturing in another
- Export through a third location
This creates multi-point exposure:
- Floods in Thailand affect component supply
- Typhoons in China delay production
- Port disruption in Vietnam impacts exports
Infrastructure variability increases uncertainty
Infrastructure quality varies significantly across regions:
- Some industrial parks have strong flood protection and utilities
- Others remain vulnerable to power outages, water shortages, or transport disruption
This uneven resilience means that two similar operations in different locations can face very different risk profiles.
ESG doesn’t fail because companies lack effort — it fails because they don’t know where to start.
👉 Get the ESG Starter Checklist (free) A practical starting point for companies in Asia.
🔗 Continue to Part 2
In Part 2, we take this foundation further:
- How to calculate risk scores
- How to translate risk into financial/business impact
- How to define practical mitigation strategies
- How to integrate into ESG reporting
👉 Continue reading: How to Assess Physical Climate Risk: Physical Risk Scoring & Mitigation Guide (Part 2)
References
- World Bank –“Physical Climate Risk Assessment – A Practical Note for EMDEs”
- NGFS – Physical Climate Risk Assessment: Practical Lessons Network for Greening the Financial System
- EPRI – Physical Climate Risk Assessment Scientific Foundation Electric Power Research Institute
- Continuuiti – Physical Climate Risk Analysis
- XDI Systems – Getting Started with Physical Climate Risk Assessments
- BII – Physical Risk Assessment Guide
- CDKN – Climate Risk Assessment Guide (Central Asia)
McKinsey – Climate Risk and Response in Asia