
Learn how to calculate employee turnover rate step by step, with detailed formulas, examples, and common mistakes. Includes ESG reporting insights and Asia-specific challenges.
Takeaway
Employee turnover rate is one of the simplest ESG metrics to calculate—but one of the easiest to misinterpret.
The real value comes from:
- Clear definitions
- Consistent methodology
- Deeper breakdowns
Companies that treat turnover as a strategic indicator, not just an HR statistic, gain a real advantage in managing talent, cost, and long-term performance.
1. What Is Employee Turnover Rate?
Employee turnover rate measures the percentage of employees who leave a company over a defined period.
However, in an ESG context, turnover is not just an operational HR metric. It is increasingly used as a proxy for deeper organizational dynamics
At a basic level, it tells you:
- How stable your workforce is
- How often you need to replace employees
But in ESG, turnover goes beyond operational HR metrics. It is increasingly used as a proxy for deeper organizational dynamics. A high or rising turnover rate can signal underlying issues such as weak management practices, poor working conditions, lack of employee engagement, or uncompetitive compensation structures. Conversely, a stable or improving turnover rate may indicate strong organizational culture, effective leadership, and sustainable workforce practices.
👉 This is why turnover is increasingly treated as a core Social KPI, especially under human capital disclosures. It provides stakeholders with insight into how well a company manages one of its most critical assets: its people.
2. Why Turnover Accuracy Matters
Before jumping into formulas, it’s important to understand why accuracy matters.
In ESG reporting, data is not only used internally but also disclosed externally to investors, regulators, and other stakeholders. This means that inconsistencies or errors in calculation can have broader implications.
A poorly calculated turnover rate can:
- Mislead internal decision-making
- Create inconsistencies in ESG reporting
- Raise red flags for investors
For example:
- A low turnover rate may look positive
- But if calculated incorrectly, it may hide retention issues

👉 In ESG, credibility of data is just as important as the number itself
3. Step-by-Step: How to Calculate Employee Turnover Rate
Step 1: Define the Reporting Period
The first step is to clearly define the time period over which turnover will be measured. Companies typically choose between monthly, quarterly, or annual reporting periods. Each serves a different purpose.
Common options:
- Monthly → useful for internal HR tracking
- Quarterly → useful for management reporting
- Annual → standard for ESG disclosures
The choice of period matters because turnover rates can vary significantly depending on the timeframe. Shorter periods may show volatility, while longer periods smooth out fluctuations.
👉 For ESG purposes, companies typically report annual turnover rate, but track it monthly internally.
Step 2: Clearly Define “Who Counts as an Employee”
This is one of the most overlooked steps.
Before counting exits, companies must establish who is included in the employee population.
Typically, full-time and part-time employees are included. However, the treatment of contract workers, temporary staff, and outsourced labor varies widely across organizations. This is particularly relevant in Asia, where many industries rely heavily on non-permanent labor.
Typical Include:
- Full-time employees
- Part-time employees
Decide (and disclose clearly):
- Contract workers
- Temporary staff
- Outsourced labor
Excluding these groups can significantly understate actual workforce turnover and create a misleading picture of workforce stability. For example, a manufacturing company may report low turnover among permanent staff while experiencing high churn among contract workers who are essential to operations.
👉 ESG best practice: not necessarily to include all categories, but to define the boundary clearly and disclose it transparently.
Step 3: Count the Number of Employees Who Left
The next step is to calculate the total number of employees who left during the reporting period. This includes all types of exits such as voluntary resignations, involuntary terminations, and retirements.
It is important to distinguish between actual exits and internal workforce movements. Internal transfers, for example, should not be counted as turnover since the employee remains within the organization. Similarly, temporary leave such as maternity leave or sabbaticals should be excluded.
Include:
- Voluntary resignations
- Terminations
- Retirements
A common mistake at this stage is to confuse exits with hiring activity. Replacement hires or open positions do not factor into turnover calculations. The focus should remain strictly on employees who have left the organization entirely.
Step 4: Calculate Average Headcount
Once exits are determined, the next step is to calculate the average number of employees during the period.
Formula:
Average Employees = (Employees at beginning of period + Employees at end of period) / 2
This step is essential because workforce size is rarely static. Using only the end-of-period headcount can distort the turnover rate, especially in fast-growing companies. For instance, if a company doubles its workforce over the year, using only the final headcount would artificially lower the turnover rate.
👉 Average headcount gives a more accurate representation of workforce size over time
Step 5: Apply the Turnover Formula
With all components defined, the turnover rate can be calculated using the standard formula.
Formula:
Turnover Rate = (Number of employees who left / Average number of employees) × 100
Full Example
- Employees at start of year: 480
- Employees at end of year: 520
- Employees who left: 50
Step 1: Calculate average employees = (480 + 520) / 2 = 500
Step 2: Apply formula = (50 / 500) × 100 = 10% turnover rate
4. Go Beyond the Basic Formula (Critical for ESG)
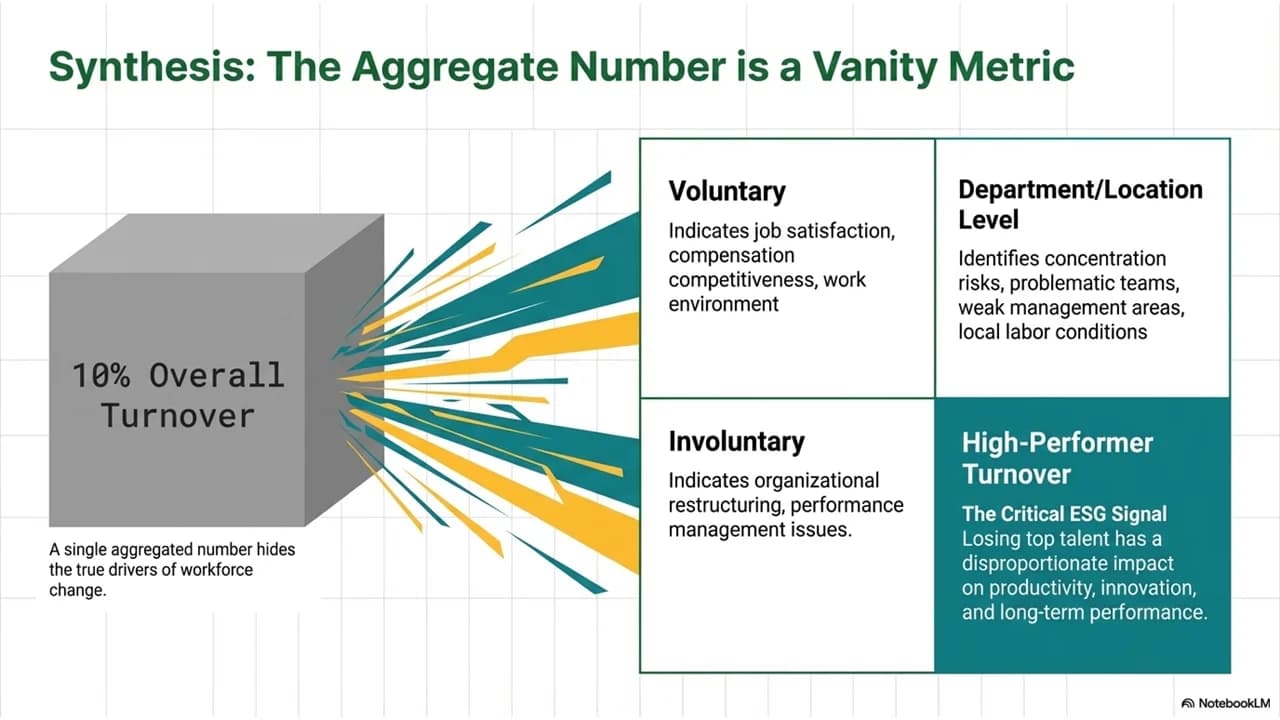
While the basic turnover rate provides a useful overview, it is insufficient for meaningful ESG analysis. A single aggregated number does not reveal the underlying drivers of workforce changes.
To generate real insights, break it down into:
1. Voluntary Turnover
Employees who chose to leave
👉 Indicates:
- Job satisfaction
- Compensation competitiveness
- Work environment
2. Involuntary Turnover
Employees who were terminated
👉 Indicates:
- Organizational restructuring
- Performance management issues
3. Department-Level Turnover
Further segmentation by department, role, or location can reveal concentration risks. For example, high turnover in a specific department may point to management issues, while high turnover in a particular geography may reflect local labor market conditions.
👉 Department-level turnover helps identify:
- Problematic teams
- Weak management areas
4. High-Performer Turnover
This is one of the most critical ESG signals. Losing top talent has a disproportionate impact on productivity, innovation, and long-term performance, making it one of the most important indicators from an ESG perspective.
5. Common Mistakes in Calculating Turnover
Many companies make avoidable errors when calculating turnover, which can compromise the reliability of their data.
❌ Mistake 1: Using Only End-of-Year Headcount
This underestimates turnover in growing companies
❌ Mistake 2: Mixing Voluntary and Involuntary Turnover
This hides the root cause of workforce changes
❌ Mistake 3: Inconsistent Time Periods
Comparing monthly vs annual data leads to misleading conclusions
❌ Mistake 4: Ignoring Contract Workers
In organizations where contract workers compose a good part of the workforce, this could be a problem, particularly, this is very common in Asia.
❌ Mistake 5: No Clear Definition of “Exit”
Different departments may count exits differently. This make data that looks precise, but is not reliable

6. Asia-Specific Insights
In many Asia fast-growing economies, rapid workforce expansion can distort turnover rates. When hiring outpaces exist, turnover may appear artificially low, even if retention issues exist. This makes it essential to analyze turnover alongside hiring trends.
Another important factor is the widespread use of contract labor in sectors such as manufacturing, construction, and logistics. Excluding these workers from calculations can create a false impression of workforce stability, particularly when they form a significant portion of the operational workforce.
Cultural dynamics also play a role. In many Asian workplaces, employees are less likely to express dissatisfaction openly. As a result, companies may not detect early warning signs or turnover could spike suddenly.
Finally, fragmented HR systems across countries and business units often lead to inconsistent data collection and reporting. Without standardized definitions and processes, companies may struggle to produce reliable turnover disclosures.

7. How to Use Turnover Data Effectively (From Reporting → Action)
Calculating turnover is only the starting point. To derive value from this metric, companies must translate data into action.
To make it useful:
Step 1: Identify trends
- Is turnover increasing or stable?
Step 2: Segment the data
- By department
- By role
- By location
Step 3: Link to root causes
- Compensation
- Management
- Work conditions
Step 4: Take action
Depend on the root causes analysis in step 3, companies must start target interventions such as:
- Improve onboarding
- Adjust pay structures
- Invest in training
When used effectively, turnover becomes not just a reporting metric, but a strategic tool for improving workforce stability and organizational performance.
References: